

Cartesian Coordinate System and Functions
Important Points
Why Abscissa and Ordinate?
This terminology enables us to refer to the horizontal and vertical axes
(and the first and second coordinates) in a manner that is independent
of the labeling of the axis. Sometimes the axes are labeled by using
other letters such as s, t, u or v; in these cases, when we discuss the
x-axis, for example, we may not have an x-axis.
Of course, the letters x and y are symbols representing the horizontal
and vertical axes. Whatever we say about the “x-axis” we are saying
about the horizontal axis, whatever its name.
Sometimes it is convenient to refer to the axes without referring to a
specific coordinate axis label.
The correct answer is (b): Q is between P and R if and only if the
distance from P to R equals the combined distances from P to Q and
Q to R. This statement is summarized in the equation
d(P,R) = d(P,Q) + d(Q,R).
Comments: Statements (a) and (c) imply the three points form a
right triangle . . . that’s not what we want. Statement (d) means R is
between P and Q . . . close but not what we wanted either.
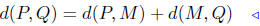
To understand the solution, draw a picture of three colinear points in
the plane. Label the two extreme points P and R and the one between
them Q. Observe that d(P,R) = d(P,Q) + d(Q,R).
To understand my comments, draw pictures in the plane to reflect
each alternative.
Solutions to the Quiz. The basic tool is the horizontal distance
formula (2).
1. Yes. Since the ordinates of the two points (2, 6) and (−4, 6) are
equal, this means, by (2), they are horizontally oriented.
2. Answer (c). The distance between the points P(3,−9) and
Q(8,−9) is
d(P,Q) = |x1 − x2| = |3 − 8| = | − 5| = 
3. Answer (d). The distance between the points P(6,−3) and
Q(−3,−3) is
d(P,Q) = |x1 − x2| = |6 − (−3)| = |6 + 3| = 
Notice the use of the parentheses to properly evaluate the formula.
4. Answer (a). The distance between the points P(−5, 2) and
Q(−9, 2) is
d(Q, P) = |x1 − x2| = | − 5 − (−9)| = | − 5 + 9| = |9 − 5| =

Again, note the use of parentheses to properly evaluate the formula.
Of course, d(P,Q) = d(Q, P)—I hope that didn’t bother
you.
Did you get 100%? I hope so.
Let the Cartesian coordinates of M be denoted by M( ). We can
compute the values of  and
and
 by simply describing the geometric
properties of M:
 |
M is between P and Q |
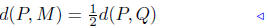 |
M is halfway between |
We have two equations and two unknowns ( and
and
 ), we can solve for
 and
and  However, this method is rather messy.
The enthusiastic student can pursue this train of thought.
Models for Functions.
In this section we present different ways of thinking about functions
that may be of help to you.
 A Function as a Mapping.
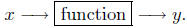
One traditional way of looking at a function is as a mapping or a
transformation. Let f:A → B be a function, and let x ∈ A. As discussed
above, y = f(x) is the value of the function at x. We can also
look upon f as a mapping or transformation: f maps x onto y, or, y
is the image of x under f.
This interpretation is one of the origins of the notation introduced
above:

Try to get the feeling for this interpretation. Imagine a bunch of arrows
pointing from elements x in the set A to elements y in the set B. The
arrows point from each x to the corresponding value of y, as the “arrow
notation” above suggests. When we see x we immediately think of its
corresponding value f(x). The Venn Diagram, described next, is a
more visual representation.
 Venn Diagram of a Function.
 In Figure I-1, a pictorial representation of a function (mapping,
transformation) is given. This graph represents f as it
maps or transforms a typical element x from the domain set
A into the co-domain set B. The image of x under this map, f, is denoted
by y in the figure. Visualize a function as a bunch of “arrows”
pointing from set A into set B. The tail of a typical arrow is at x, and
the arrow “points” to the corresponding y-value.
This model is very useful in understanding functions and various operations
performed on functions (such as composition of functions).
 To further illustrate the point, Figure I-2 depicts a relation
that is not a function. A function is a rule that associates
with each value x is a certain domain set, a corresponding
unique y-value. A rule that associates with at least one x more than
one corresponding y-value would not be a function—as illustrated
in Figure I-2. Observe that associated with x is two corresponding
values—labeled y and z.
As a particular example of this, consider the equation: x2 + y2 = 1.
For x = 0, there are two values of y that satisfy this equation: y = 1
and y = −1. This equation does not define, therefore, y as a function
of x. (Visualize two arrow coming out of x = 0, one pointing to y = 1
and the other pointing to y = −1.
 A Function as a Black Box.
This interpretation of function is often associated with the engineering
world. A function is like a machine (a black box). We have a machine
(a black box) that takes input into it, and, as a result, yields output.
The black box is the function, the input are the values in the domain
of the function, and the output of the box (function) are the values
in the range of the function.
Actually, this looks more like a white box to me :={).
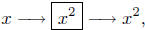
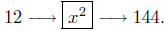
A black box you are familiar with is the hand-held calculator. This
is usually, literally, a black box. You input x-values on the keypad,
say x = 12. You then choose the black box to input this value of x
into. Your calculator is actuallymade up of a large number of black
boxes—called function keys (Hey, function!). Choose the function key
labeled

and press it – out comes the output. You will see (on your real or
imagined display panel) the value 144.
This is a representation of the black box model.
put x = 12,
Input-output, input-output – and that’s the way it works.